Global Unemployment
CONCEPT
Understanding the shifts in global unemployment dynamics remains paramount for policymakers, economists, and researchers alike. Spanning from 2014 to 2024, this dataset presents a comprehensive analysis of unemployment trends across diverse demographic dimensions. The central focus lies in examining the data by country, age group, and gender, thereby providing valuable insights into the myriad factors influencing labor markets worldwide.
DATA
Contained within the dataset are crucial columns such as country name, indicator, gender, age group, and annual unemployment rates covering the period from 2014 to 2024. This expansive dataset facilitates profound analysis and correlation studies. Through examining the intricate connections between age, gender, and unemployment rates, researchers can derive invaluable insights into the complexities of the global workforce dynamics.
Key Findings
1. Countries with Highest and Lowest Average Unemployment Rates:
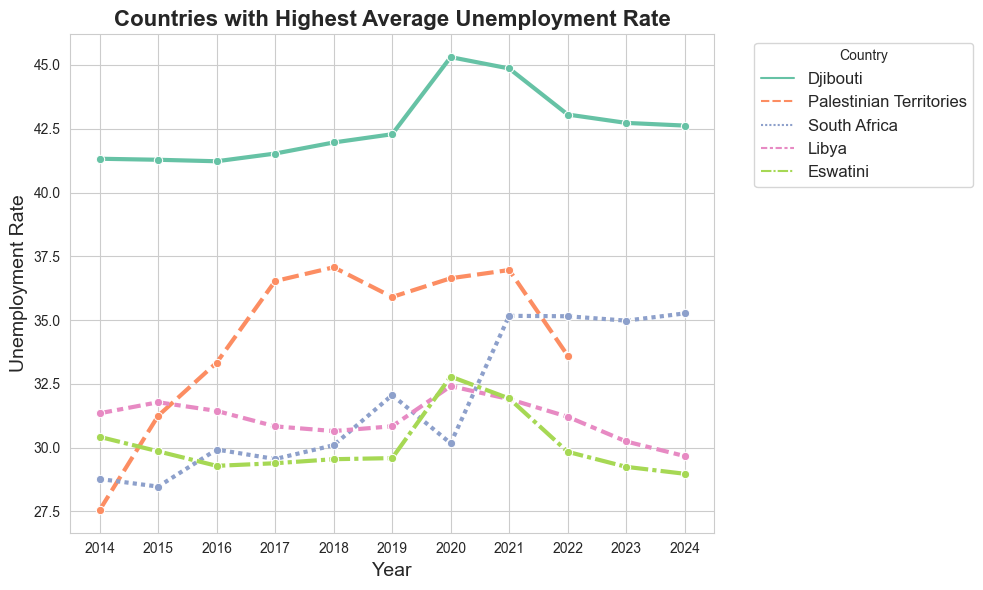
- From the first figure, it is evident that Djibouti had the highest unemployment rates from 2014 to 2024. Additionally, the unemployment rate in the Palestinian Territories increased drastically from 2014 to 2018, plateauing until 2021, making it the second country with the highest average unemployment rate.
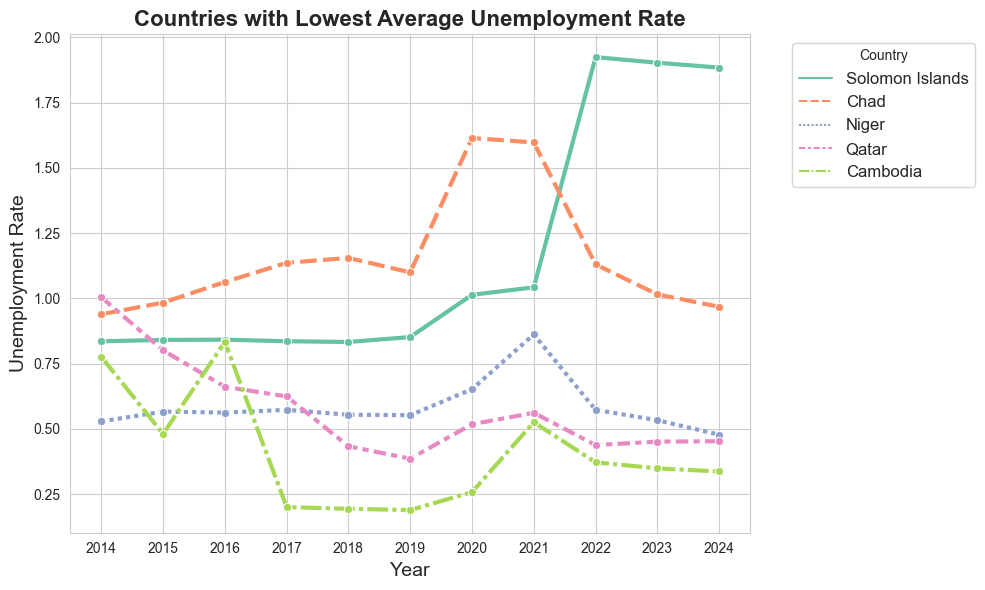
- Conversely, Cambodia had the lowest unemployment rate with an average as low as 0.4%, followed by Niger with the second lowest unemployment rates.
- These two graphs also highlight the significant impact of COVID-19 on global unemployment rates. There was a noticeable spike in unemployment rates for all countries from 2020 to 2021 as a result of the pandemic.
2. Age Groups
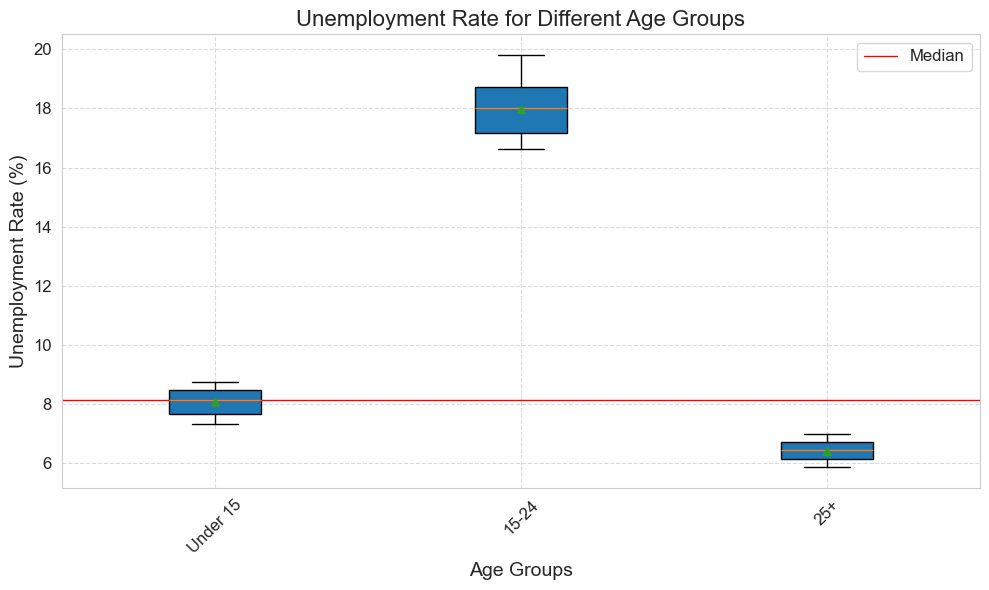
- After analysing the data to uncover relationships between unemployment rates and age groups, it was discovered that the unemployment rate for the 15-24 age group, with a median of 18%, is approximately 2.5 times higher than the unemployment rate for those under 15, which has a median of 8%. Additionally, the median unemployment rate for individuals aged 25 and above was found to be 7%. This notable decrease from the 15-24 age group to the 25 and above category could potentially be attributed to the accumulation of work experience, which may aid in securing employment opportunities.
3. Genders:
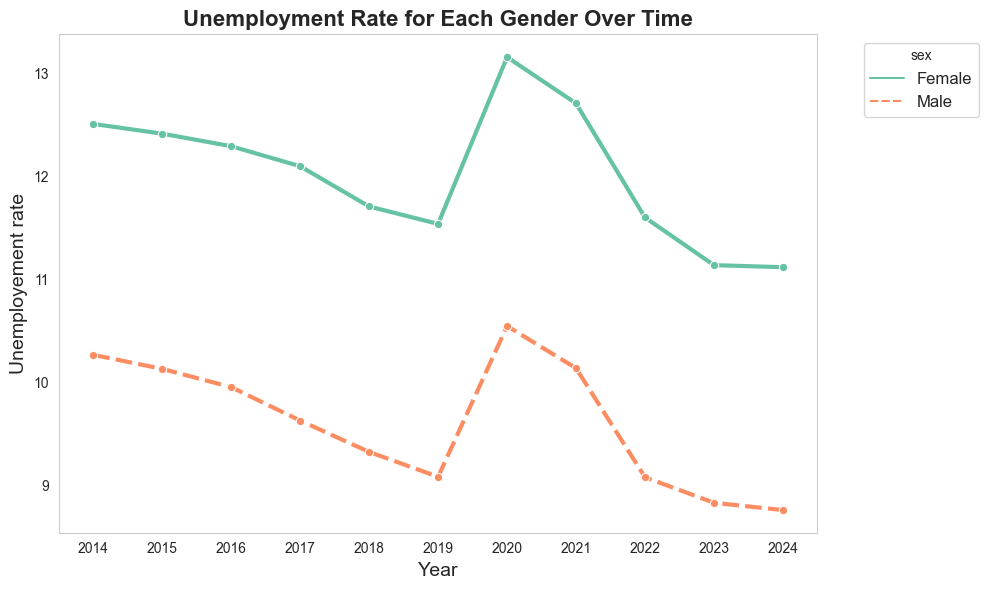
- The analysis of genders led to the creation of the last line chart, illustrating the changes in unemployment rates for each gender over time. The trends in both lines exhibit remarkable similarity, indicating a strong positive correlation, suggesting that the effective unemployment rates for both genders are similar. However, there is a notable difference between the mean unemployment rates of each gender. As depicted in the figure, the unemployment rate is higher for females compared to males. This difference could potentially be attributed to unequal opportunities for the genders.
Github Repository

Countries with Lowest Unemployement Rate

Countries with Highest Unemployement Rate

Unemployment Rate for age groups

Unemployment Rate For each Gender Over Time